Initially RealCADD will open with a new Plan – "Untitled 1" – which will be displayed at the bottom of the Window menu. As more drawings are opened, they will add to the list. To move from one to another, simply click the one you want. The current drawing will be ticked.
The Edit pallet has been discussed in the Window >> Tools section, as it applies to each individual tool and thus any object that can be drawn. Here these all are brought together.
There is however one feature of the Edit pallet that we haven't discussed (it's new to v4.60): that is the ability to copy and paste the edit data. Data is copied by ⌃-click (control-click) or a right-click on the data to be copied. This will produce a drop-down menu with a varying number of options – select "Copy". Move to where you want to paste the data and hit Paste (⌘V).
This is useful for example if you wanted to rotate an object to match the angle of something else (a line, say). Click on the line. Copy the angle. Select the object. Hit Rotate (⌘R) and paste in the angle. That saves trying to memorize the angle or having to write it down – assuming it's not an easy number to remember.
Tip: The Copy function only works in the Cocoa version of RealCADD, not in the Carbon version.
 The Edit pallet for Lines
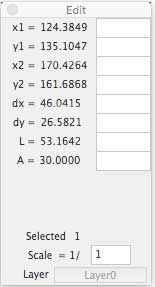
This is the Edit pallet for drawing lines. Here it is showing the data for the red line in the example below. When you click on the drawing with one of the Line Tools, the left-hand part of the pallet will fill with live data until you have completed the line. After you have drawn the line, clicking it with the Select tool will display the data and you can edit it in the right-hand boxes. The positional data (x1, y1, x2, y2) is relative to the zero point of your drawing which by default is the top left hand corner – but you can change this – see Preferences >> Display.
 The red line is drawn from top left to bottom right.
x1: Start point on the x-axis.
y1: Start point on the y-axis.
x1: End point on the x-axis.
y1: End point on the y-axis.
dx: x-axis distance.
dy: y-axis distance
L: Line actual length.
A: Line angle.
Selected: The number of objects selected.
Scale: The scale the line is drawn at.
Layer: The layer the line is drawn on.
 Tip: Angles show as the absolute angle counting clockwise, so our red line shows 30º. This is with positive y downwards (the default). If you select for positive y upwards, then angles will count anti-clockwise (and A would show as 330º), and y1, y2 and dy would be negative.
Tip: The Layer box is dimmed if the selected object is on the active layer; it changes to undimmed if the selected object is not on the active layer, in which case clicking the Layer box will move you to the layer the object is on, and make that the active layer.
To edit the data, type the required new data in the appropriate box and hit the Enter key. Most commonly with a line you will want to edit the length and/or angle, but you can edit any of the data.
Tip: You can also use mathematical functions (=, +, -, *, /) in the data editing boxes. For example suppose you want the red line to be one-and-a-half times as long, you can type *1.5 in the length data box. RealCADD will multiply the existing length of the line (as shown in the left-hand data figures) by 1.5 and extend the line (in the direction it was originally drawn) to the new length.
 The Edit pallet for Rectangles
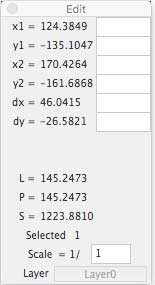
This is the Edit pallet for drawing rectangles. Here it is showing the data for the red rectangle in the example below. When you click on the drawing with one of the Rectangle Tools, the left-hand part of the pallet will fill with live data until you have completed the rectangle. After you have drawn the rectangle, clicking it with the Select tool will display the data and you can edit it in the right-hand boxes. The positional data (x1, y1, x2, y2) is relative to the zero point of your drawing which by default is the top left hand corner – but you can change this – see Preferences >> Display.
 The red rectangle is drawn from top left to bottom right.
x1: Start point on the x-axis.
y1: Start point on the y-axis.
x1: End point on the x-axis.
y1: End point on the y-axis.
dx: x-axis distance = the width of the rectangle.
dy: y-axis distance = the height of the rectangle.
L: Length of all four sides added together.
P: Perimeter length (for a rectangle the same as L).
S: Area of the rectangle.
Selected: The number of objects selected.
Scale: The scale the rectangle is drawn at.
Layer: The layer the rectangle is drawn on.
Tip: In this example we have checked the "Invert Y-axis (positive upwards)" box in Preferences >> General, so y1, y2 and dy are showing as negative numbers.
Tip: The Layer box is dimmed if the selected object is on the active layer; it changes to undimmed if the selected object is not on the active layer, in which case clicking the Layer box will move you to the layer the object is on, and make that the active layer.
To edit the data, type the required new data in the appropriate box and hit the Enter key. Most commonly with a rectangle you will want to edit dx length and/or dy, but you can edit any of the data.
 Tip: You can also use mathematical functions (=, +, -, *, /) in the data editing boxes. For example suppose you want the red rectangle to be one-and-a-half times as wide, you can type *1.5 in the dx data box. RealCADD will multiply the existing width of the rectangle (as shown in the left-hand data figures) by 1.5 and extend the rectangle (in the direction it was originally drawn) to the new width.
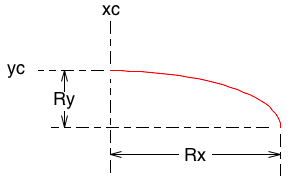
The Edit Pallet for a Rounded Rectangle
This is the Edit pallet for rounded rectangles; there are two additional data fields:
Rx: x-axis corner radius.
Ry: y-axis corner radius.
With a rounded rectangle L and P are the same and are the length of the four sides plus the lengths around the four corner arcs, added together
Commonly, a rounded rectangle has Rx and Ry the same; but RealCADD does allow you to have different Rx and Ry, in which case the corner arcs are elliptical rather than circular.
The data is edited just as for a normal rectangle.
Tip: By default RealCADD draws rounded rectangles with a 10 pixel (3.5278mm or 0.1389" at scale 1/1) radius at the corners. So you will always get a 10 pixel Rx and Ry, until the rectangle is drawn and you edit it. For example, drawing in millimetres at a scale of 1:10, RealCADD will draw Rx and Ry at 3.5728 * 10 = 35.2778mm. Or, drawing in inches at a scale of 1:12, RealCADD will draw Rx and Ry at 0.1389 x 12 = 1.6667".
The Edit Pallet for Ovals
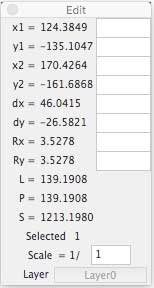
This is the Edit pallet for drawing ovals and circles. Here it is showing the data for the red ellipse in the example below. When you click on the drawing with one of the Oval Tools, the left-hand part of the pallet will fill with live data until you have completed the ellipse or circle. After you have drawn the ellipse or circle, clicking it with the Select tool will display the data and you can edit it in the right-hand boxes. The positional data (x1, y1, x2, y2) is relative to the zero point of your drawing which by default is the top left hand corner – but you can change this – see Preferences >> Display.
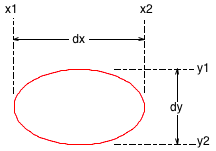 The red ellipse is drawn from top left to bottom right.
x1: Start point on the x-axis.
y1: Start point on the y-axis.
x1: End point on the x-axis.
y1: End point on the y-axis.
dx: x-axis distance.
dy: y-axis distance.
L: Circumference
P: Perimeter length = circumference .
S: Area of the ellipse or circle.
Selected: The number of objects selected.
Scale: The scale the oval or circle is drawn at.
Layer: The layer the oval or circle is drawn on.
Tip: In this example we have checked the "Invert Y-axis (positive upwards)" box in Preferences >> General, so y1, y2 and dy are showing as negative numbers.
Tip: The Layer box is dimmed if the selected object is on the active layer; it changes to undimmed if the selected object is not on the active layer, in which case clicking the Layer box will move you to the layer the object is on, and make that the active layer.
To edit the data, type the required new data in the appropriate box and hit the Enter key. Most commonly with an ellipse or circle you will want to edit dx and/or dy, but you can edit any of the data.
Tip: You can also use mathematical functions (=, +, -, *, /) in the data editing boxes. For example suppose you want the x-axis of the red ellipse to be one-and-a-half times as long, you can type *1.5 in the dx data box. RealCADD will multiply the existing dx (as shown in the left-hand data figures) by 1.5 and extend the ellipse (in the direction it was originally drawn) to the new x-axis length.
Tip: There is an anomaly in how RealCADD deals with circles drawn from the centre – rather than display the radius and the x and y location of the centre, it displays the diameter (dx and dy), and doesn't record the centre from which the circle was drawn. This means that if you wish to edit a circle drawn from the centre to change the radius, in fact you can only edit the diameter and you have to enter both dx and dy as the same to maintain it as a circle; and because of this the centre of the circle moves, and thus it has to be repositioned afterwards to maintain the same centre.
 The Edit pallet for Circular Arcs
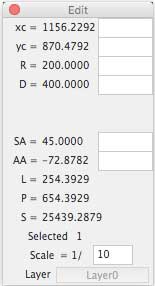
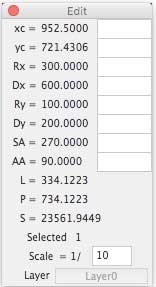
This is the Edit pallet after an arc is drawn. It is showing the data for the red arc in the example below. When you click on the drawing with one of the Arc Tools, at first the Edit pallet for a Line will be displayed while you are drawing the blue radius line. Once you start drawing the actual radius, the Edit pallet will change to that shown. The left-hand part of the pallet will fill with live data until you have completed the arc. After you have drawn the arc, clicking it with the Select tool will display the data and you can edit it in the right-hand boxes. The positional data (x1, y1, x2, y2) is relative to the zero point of your drawing which by default is the top left hand corner – but you can change this – see Preferences >> Display.
 The red arc is drawn from top left to bottom right to establish the radius and then from bottom to top to draw the arc itself.
xc: The start point of the radius on the x-axis.
yc: The start point of the radius on the y-axis.
R: The radius of the arc.
D: The diameter of the arc.
SA: The initial absolute angle that the arc starts from - in this case 45º.
AA: The subtended angle that the arc is drawn through - in this case -72.8782º.
L: The length of the arc.
P: The perimeter of the arc, which is the length of the arc plus the top and bottom radii
S: The subtended area of the arc – that is the area within the perimeter.
Selected: The number of objects selected.
Scale: The scale the arc is drawn at.
Layer: The layer the arc is drawn on.
Tip: In this example we have not checked the "Invert Y-axis (positive upwards)" box in Preferences >> General, so positive y is downwards. As we drew the arc upwards, the subtended angle is negative.
Tip: The Layer box is dimmed if the selected object is on the active layer; it changes to undimmed if the selected object is not on the active layer, in which case clicking the Layer box will move you to the layer the object is on, and make that the active layer.
To edit the data, type the required new data in the appropriate box and hit the Enter key. Most commonly with an arc you will want to edit the radius, but you can edit any of the data.
Tip: You can also use mathematical functions (=, +, -, *, /) in the data editing boxes. For example suppose you want the subtended angle to be -90º, simply enter -90 in the AA box. RealCADD will extend the arc to subtend 90º; the centre and the start point will remain the same.
 The Edit pallet for Elliptical Arcs
This is the Edit pallet for drawing elliptical arcs. Here it is showing the data for the red arc in the example below. When you click on the drawing with the Elliptical Arc Tools, the left-hand part of the pallet will fill with live data until you have completed the arc. After you have drawn the arc, clicking it with the Select tool will display the data and you can edit it in the right-hand boxes. The positional data (x1, y1, x2, y2) is relative to the zero point of your drawing which by default is the top left hand corner – but you can change this – see Preferences >> Display.
 The red elliptical arc is drawn from top left to bottom right.
xc: The start point of the arc on the x-axis.
yc: The start point of the arc on the y-axis.
Rx: The x-radius of the arc.
Dx: The x-diameter of the arc.
Rx: The y-radius of the arc.
Dx: The y-diameter of the arc.
SA: The initial absolute angle that the arc starts from - in this case 270º.
AA: The subtended angle that the arc is drawn through - 90º.
L: The length of the arc.
P: The perimeter of the arc, which is the length of the arc plus Rx and Ry.
S: The subtended area of the arc – that is the area within the perimeter.
Selected: The number of objects selected.
Scale: The scale the arc is drawn at.
Layer: The layer the arc is drawn on.
Tip: The Layer box is dimmed if the selected object is on the active layer; it changes to undimmed if the selected object is not on the active layer, in which case clicking the Layer box will move you to the layer the object is on, and make that the active layer.
To edit the data, type the required new data in the appropriate box and hit the Enter key.
Tip: You can also use mathematical functions (=, +, -, *, /) in the data editing boxes. For example if you enter -90 in the AA box this will flip the arc horizontally about the xc and yc point. Or if you change AA to be 360º you will get a full ellipse about xc and yc.
 The Edit pallet for Polygons, Splines and Pencil
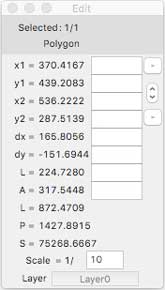
This is the Edit pallet for drawing polygons, splines and the pencil (which basically draws a freehand spline). Here it is showing the data for the red irregular polygon in the example below, but the data is basically the same for regular polygons and splines. When you click on the drawing with the Polygon, Spline or Pencil Tools, the left-hand part of the pallet will fill with live data until you have completed the polygon or spline. After you have drawn the polygon or spline, clicking it with the Select tool will display the data and you can edit it in the right-hand boxes. The positional data (x1, y1, x2, y2) is relative to the zero point of your drawing which by default is the top left hand corner – but you can change this – see Preferences >> Display.
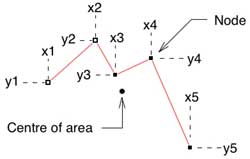 The red irregular polygon is drawn from left to right.
x1: The start point of polygon on the x-axis.
y1: The start point of the polygon on the y-axis.
x2: The end point of the first side of the polygon on the x-axis.
y2: The end point of the first side of the polygon on the y-axis.
dx: The distance on the x-axis from x1 to x2.
dy: The distance on the y-axis from y1 to y2.
L: The length of the first side from x1, y1 to x2, y2.
A: The angle of the first side from x1, y1 to x2, y2.
L: The total length of the sides of the whole polygon, from x1, y1 through to x5, y5.
P: The perimeter of the polygon, assuming a closing side drawn from x5, y5 back to x1, y1
S: The area of the polygon within the perimeter.
Selected: The number of objects selected.
Scale: The scale the polygon is drawn at.
Layer: The layer the polygon is drawn on.
We have an additional item on this Edit pallet: a small up-down arrow ![]() . Clicking this will cycle the Edit pallet through the data for the different sides of the polygon. So clicking it once will give you data for the side from x2, y2 to x3, y3; and so on through all the sides. Clicking the Up-arrow moves from left-to-right or top-to-bottom through the nodes of the polygon; the Down-arrow does the reverse.
. Clicking this will cycle the Edit pallet through the data for the different sides of the polygon. So clicking it once will give you data for the side from x2, y2 to x3, y3; and so on through all the sides. Clicking the Up-arrow moves from left-to-right or top-to-bottom through the nodes of the polygon; the Down-arrow does the reverse.
From version 4.62 there are also two small "minus" buttons  which will remove a node from the polygon. When you select a node on a polygon, two nodes get highlighted. Clicking the top minus button will delete the left or top node of the two; clicking the lower minus button will delete the right or bottom node of the two.
Tip: The Layer box is dimmed if the selected object is on the active layer; it changes to undimmed if the selected object is not on the active layer, in which case clicking the Layer box will move you to the layer the object is on, and make that the active layer.
To edit the data, type the required new data in the appropriate box and hit the Enter key. You can for example, move a node to a new location by editing its x and/or y data.
Tip: You can also use mathematical functions (=, +, -, *, /) in the data editing boxes. For example suppose you want to make the length of the x2, y2 to x3, y3 side by 20%, use the little arrow box to cycle through the polygon so that x2, y2 and x3, y3 are displayed. Then type *1.2 in the L data box. RealCADD will multiply the existing L (as shown in the left-hand data figures) by 1.2 and extend the side (in the direction it was originally drawn) to the new L length.